
Mapping Marcellus Shale gas facilities
Today Clean Air Council launched a WikiMapping project that it can use to track gas facilities in Pennsylvania. You can find it here.
 Here’s the email announcement I received:
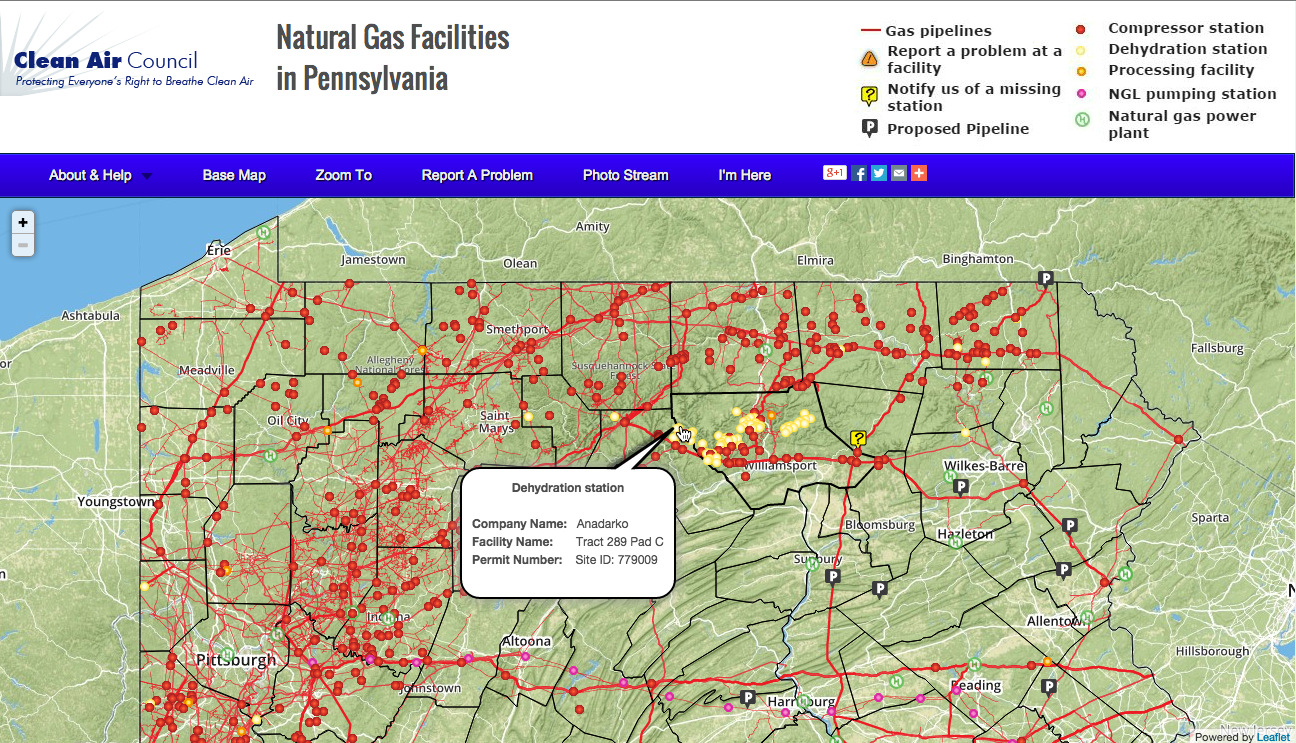
The Clean Air Council’s new shale gas infrastructure map will make it easy for residents who live near shale gas infrastructure in Pennsylvania to view nearby facilities as well as report pollution problems directly to state and federal environmental agencies! The map is now available online at:http://tinyurl.com/gasmapPA
Using the map, members of the public can see compressor stations, dehydration stations, gas processing plants, natural gas liquid pumping stations, power plants, and pipelines in the state. They can also report pollution issues from nearby facilities directly to regulatory agencies, including the Department of Environmental Protection and the U.S. Environmental Protection Agency, and public health agencies including the Agency for Toxic Substances and Disease Registry.
Residents who live near shale gas infrastructure and are experiencing air and water pollution are encouraged to use the tool online at http://tinyurl.com/gasmapPA
Thank you for helping us work towards a Pennsylvania where all residents are protected from pollution!
Why is this significant to WikiMapping:
When I met with Clean Air Council about this project, the idea was to take excel databases, make the data available to the public, and let people upload photos and media files to document gas compressor stations. Data submitted through the site would go to multiple stakeholders depending on how survey questions were answered.
Over the course of the summer, we developed an editable map-based database that could benefit this project and others.
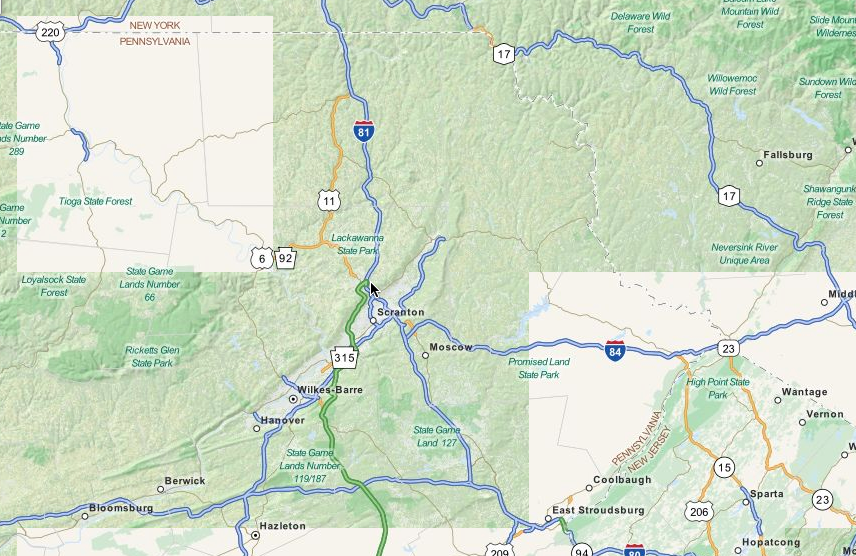
Shortly before the project launched, we found that the MapQuest basemap that we were using looked horrible. The map panels weren’t consistent and looked like this:
So, to deal with the ugly base map, we wanted to use a custom MapBox.com base map. Clean Air Council also wanted people to be able to view other base maps, such as google.
The problem with using a Mapbox base map was that we had about 18 mb of vector data to display over it. This would make the page unusable. So, I used MAPublisher, from avenza.com, to create map tiles.
I was stuck with the decision to use TileMill to create a custom base map with roads and pipeline data or to figure out some way to present the data over MapBox. Since the data will change over time, I wanted this to be as easy as possible.
The base map solution
John came up with a way to layer one set of map tiles on top of another. This enables this project to benefit from a beautiful Mapbox base and to have the speed of custom transparent map tiles. I haven’t seen this done elsewhere.
So, that was good, but then John took it a step further and created multiple base maps with multiple map tile layers.
Why care?
The Clean Air Council WikiMapping project now has the data they need displayed over a beautiful base map and a fast speed.
Why do I care?
I admire what Clean Air Council is doing, and I admire Joe Minott, Esq. (the Executive Director) for his leadership of this non-profit for about 30 years! Furthermore, I know from firsthand that the experience people get by working at Clean Air Council is invaluable. I’m grateful that WikiMapping plays a leading role in paying attention to what’s happening to our environment.
One final note… What I think is particularly great is that Joe sets an example by not owning a car.