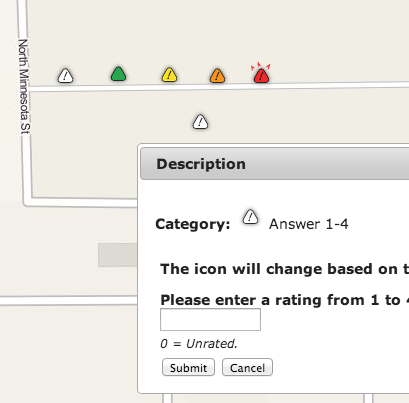
Icon Symbology can change based on survey data

Illustrator CS5 File with point samples used in the above image.
Problem: Water temperatures are being recorded at test sites in Costa Rica. Researchers need to see at a glance where the temperatures are warmer and where they are cooler.
Solution: The database doesn’t need to change. But John added new premium functionality to the points. So, based on the answer, the icon changes. And if there is no data entered, the icon defaults to 0.
Setup:
- The functionality must be added to an account.
- Create your survey
- In Edit Point Category, select the survey.
- In Edit project, select Set Multiple Icons

- Upload each icon that you’ll need.

Thoughts: To the right is an Illustrator CS5 file with the icons used in this example. I create the icons and export them to web as transparent pngs.
As I write this here in Jenkintown, PA, it’s early Saturday morning. John has worked into the night. We have an ongoing email conversation early and late in the day since he’s working from Australia.

