Overview
Line categories
When you name a category, this will be the name that shows up in the Legend, View Options, and Add Line options.
A line can be imported to a WikiMapping project as a kmz or kml file. A project might need the line to represent a border. Or the line might be there for people to comment on but not draw. There are instances when you don’t want a line to show up in the legend. There are even times when you don’t want users to see the line.
If you are logged in as a project administrator, then you see everything. But other users don’t see what you see.
No – Everyone can draw a line
Yes – Only the project administrator can draw or import lines
Above + not show in legend – The lines go on the map for people to see, but they don’t show up in the legend.
Above + not show data – Only the project administrator can see the lines.
This lets you add lines to the map for reference. Users can not comment.
If you choose not to add a survey to your project, there is still a space for people to comment.
To add a survey – Select one of your prepared surveys from the drop-down menu:
Create Survey Only – If this is not selected, then many people can add a survey to the same point. If it is selected, then only the person who adds a point or a line will be presented with the survey. Other people who select the point or line will see the survey results instead of the initial comment.
Allow Edit Create Survey Only – When this and Create Survey Only are selected, then the survey acts like an editable database. Only the person who filled in the original survey and the project administrator can edit the fields.
Tip: We think this is a GREAT feature. It was developed for researchers who are monitoring water quality in Costa Rica.
Present field – This can either present the initial comment, a field from the kmz, or the survey results.
Present Title – This is a name that you give to the present balloon.
Sort Order controls which lines show up first in the legend. Smaller numbers show up above larger, and it is possible to use negative numbers.
Sometimes Project Administrators want to share lines or points with other people. Toggling this option does this.
This functionality used to be controlled in edit project only. It can now be controlled for individual points or lines in categories.
Having agree/disagree should be so simple. As soon as a user registers a preference, it is recorded. The user can continue with other options in a dialog box or just close it.
The results of Agree/Disagree are recorded in Comments.
A user can add a line or point to a map, and if they toggle a checkbox, their data will only be visible to the project administrator and the user who entered the data.
This is a premium feature that helps researchers who want to keep their data private. There is also a preference in Edit Project that keeps all data entered visible only to the individual or to the project administrator.
Point categories
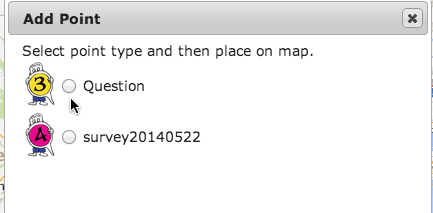
When you name a category, this will be the name that shows up in the Legend, View Options, and Add Point options.
Point icons on web maps typically center in the middle bottom of the icon. And this is why they then to be V shaped on the bottom, like this :
 .
.Consider the following when making icons:
- Adobe Illustrator, Photoshop, or other graphics programs can be used to make icons.
- The icon above is 20 x 30 pixels. You can use that as reference as you size your own icons.
- The maximum icon file size is 5k.
- Save the icons as transparent png files.
- You can create round icons, but currently the ability to center these is a premium feature.
- You can be creative with your points and make them bigger. They will get reduced in size in the legend.
People have shared icons to the icon library. The selection is somewhat random.
A point can be imported to a WikiMapping project as a kmz or kml file. A point might be there for people to comment on but not place. There are instances when you don’t want a point to show up in the legend. There are even times when you don’t want users to see the point.
If you are logged in as a project administrator, then you see everything. But other users don’t see what you see.
No – Everyone can add a point
Yes – Only the project administrator can add or import points
Above + not show in legend – The points go on the map for people to see, but they don’t show up in the legend
Above + not show data – Only the project administrator can see the points
This lets you add points to the map for reference. Users can not comment.
If you do not add a survey to your project, and users will still be able to comment.
To add a survey – Select one of your prepared surveys from the drop-down menu:
Create Survey Only – If this is not selected, then many people can add a survey to the same point. If it is selected, then only the person who adds a point or a line will be presented with the survey. Other people who select the point or line will see the survey results instead of the initial comment.
Allow Edit Create Survey Only – When this and Create Survey Only are selected, then the survey acts like an editable database. Only the person who filled in the original survey and the project administrator can edit the fields.
Tip: We think this is a GREAT feature. It was developed for researchers who are monitoring water quality in Costa Rica.
Present field – This can either present the initial comment, a field from the kmz, or the survey results.
Present Title – This is a name that you give to the present balloon.
Sort Order controls which lines show up first in the legend. Smaller numbers show up above larger, and it is possible to use negative numbers.
Sometimes Project Administrators want to share lines or points with other people. Toggling this option does this.
This functionality used to be controlled in edit project only. It can now be controlled for individual points or lines in categories.
When agree/disagree is enabled
As soon as a user registers a preference, it is recorded. The user can continue with other options in a dialog box or just close it.
The results of Agree/Disagree are recorded in Comments.
A user can add a line or point to a map, and if they toggle a checkbox, their data will only be visible to the project administrator and the user who entered the data.
This is a premium feature that helps researchers who want to keep their data private. There is also a preference in Edit Project that keeps all data entered visible only to the individual or to the project administrator.


