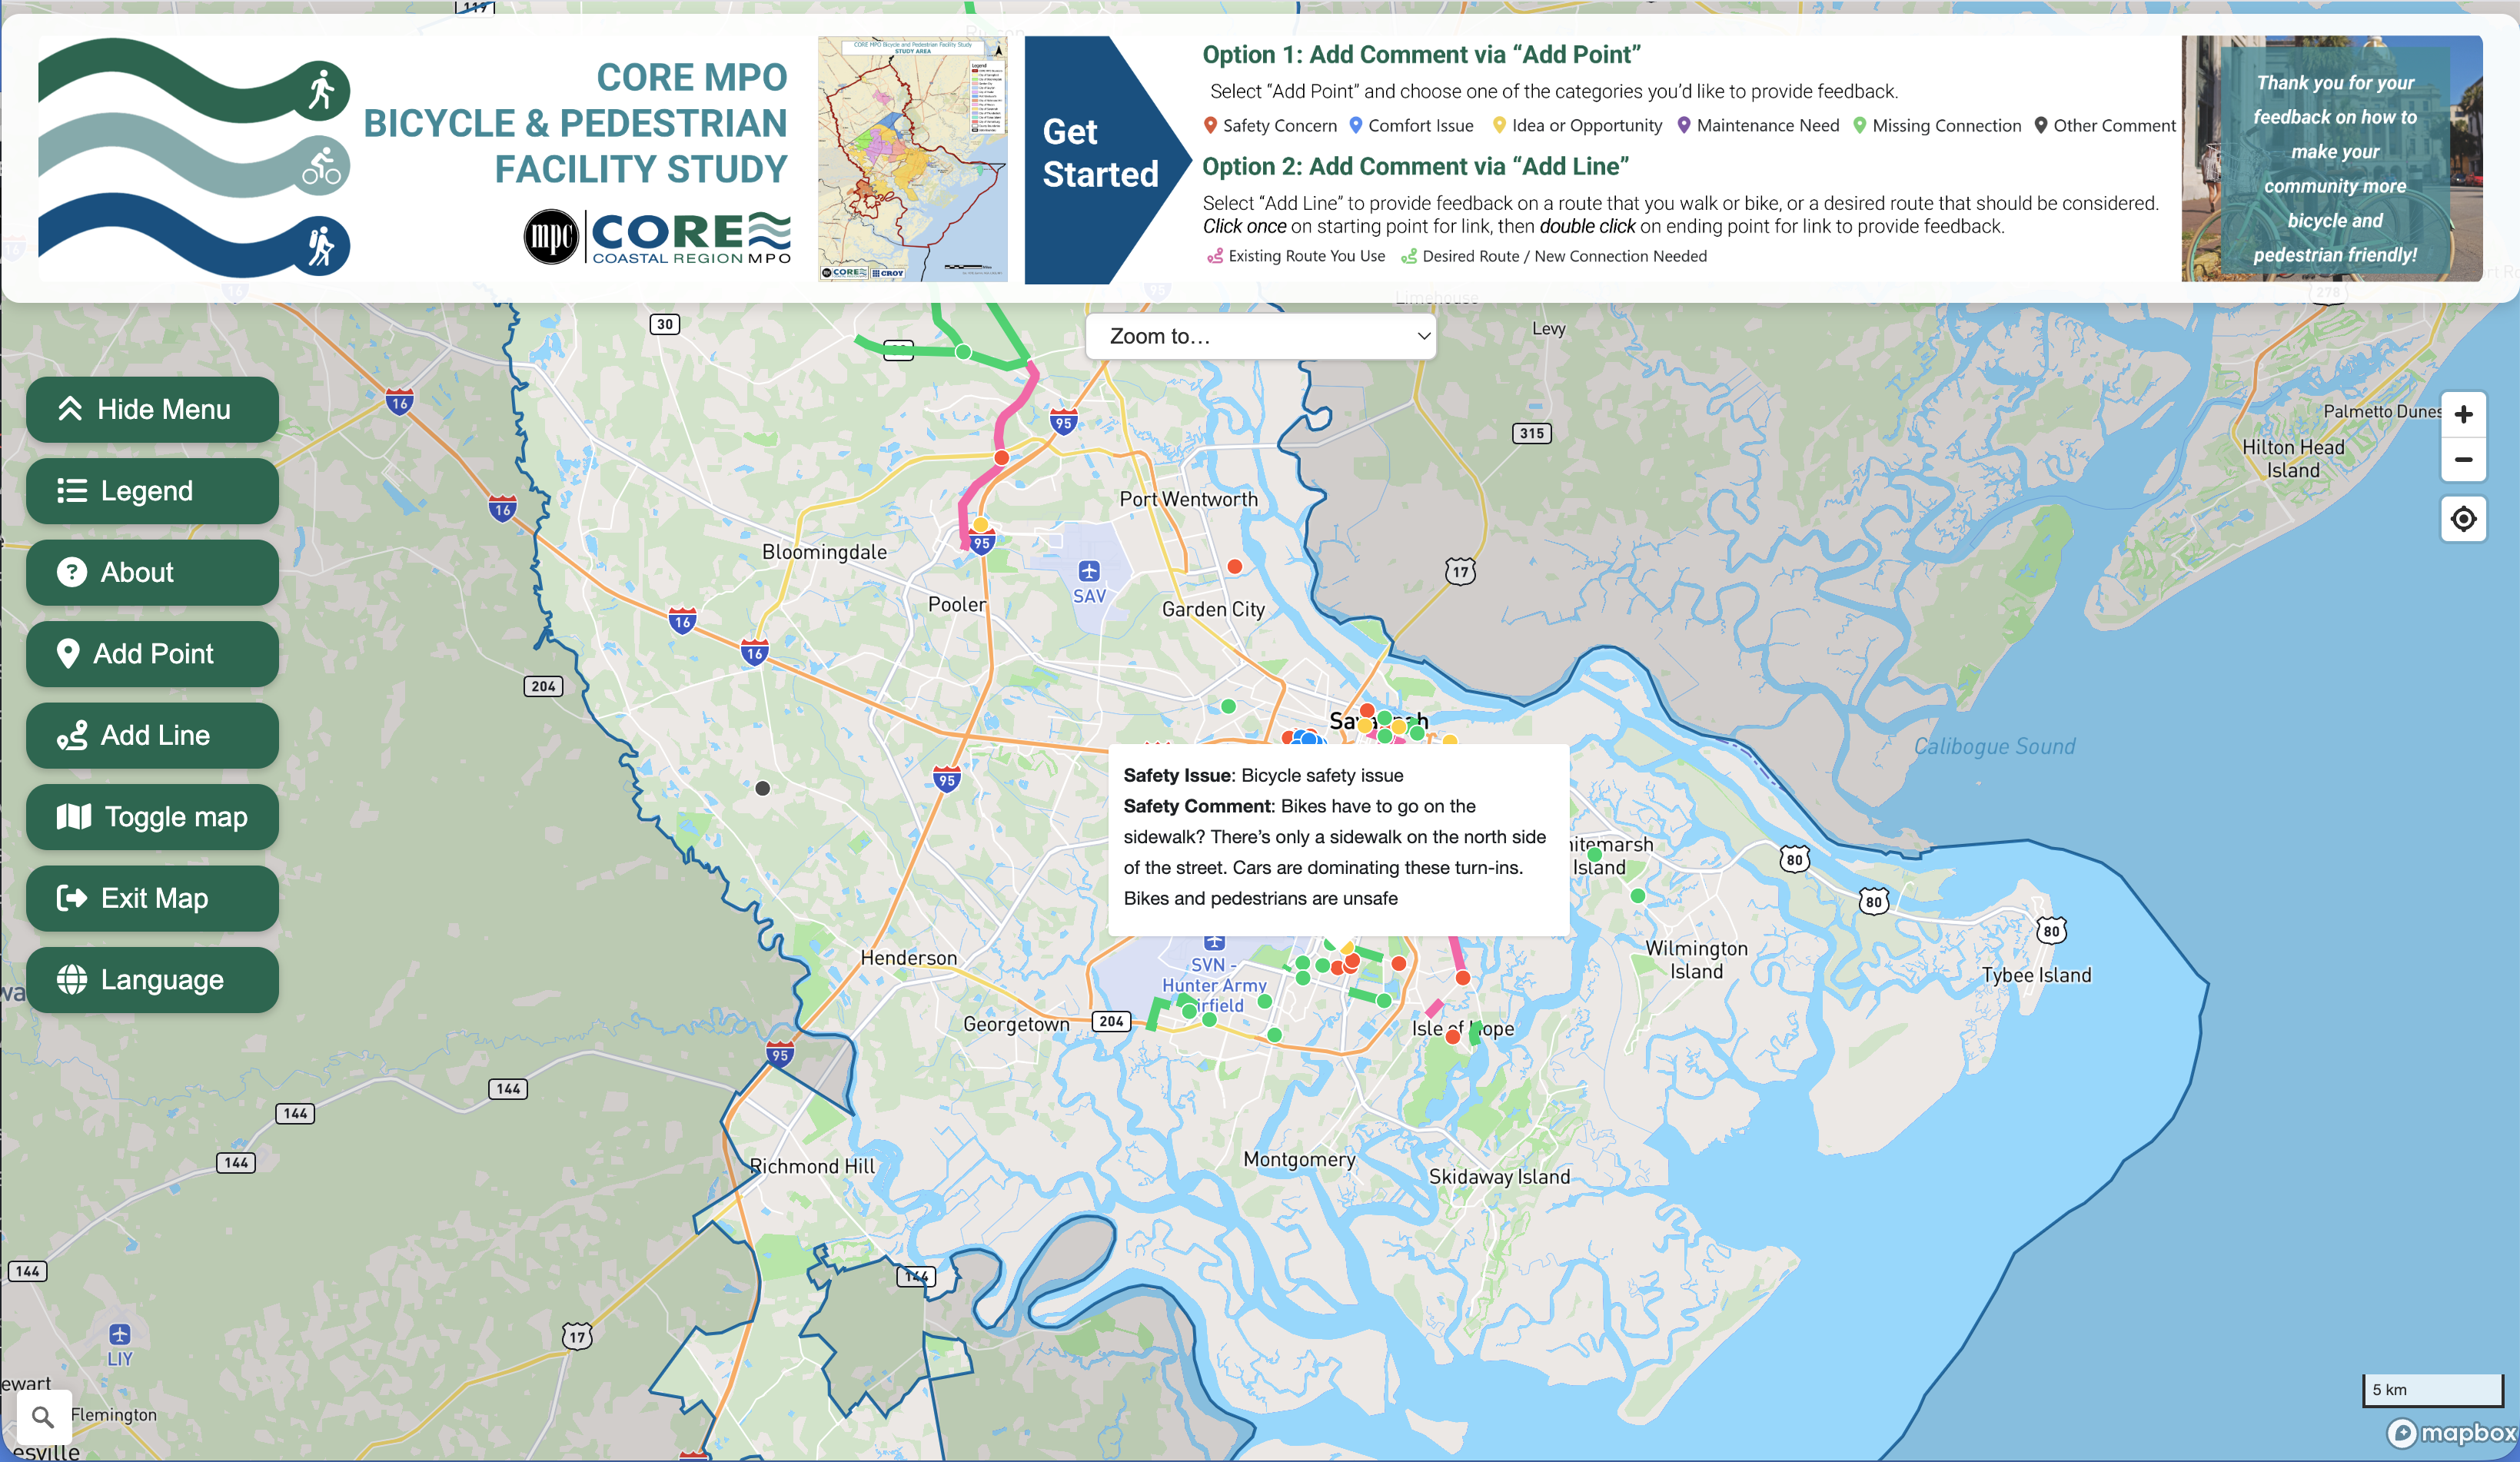
Share a link. Collect hundreds of responses.
The public drops pins, draws routes, uploads photos, and answers survey questions — directly on the map. No account required. Every response is tied to a location.
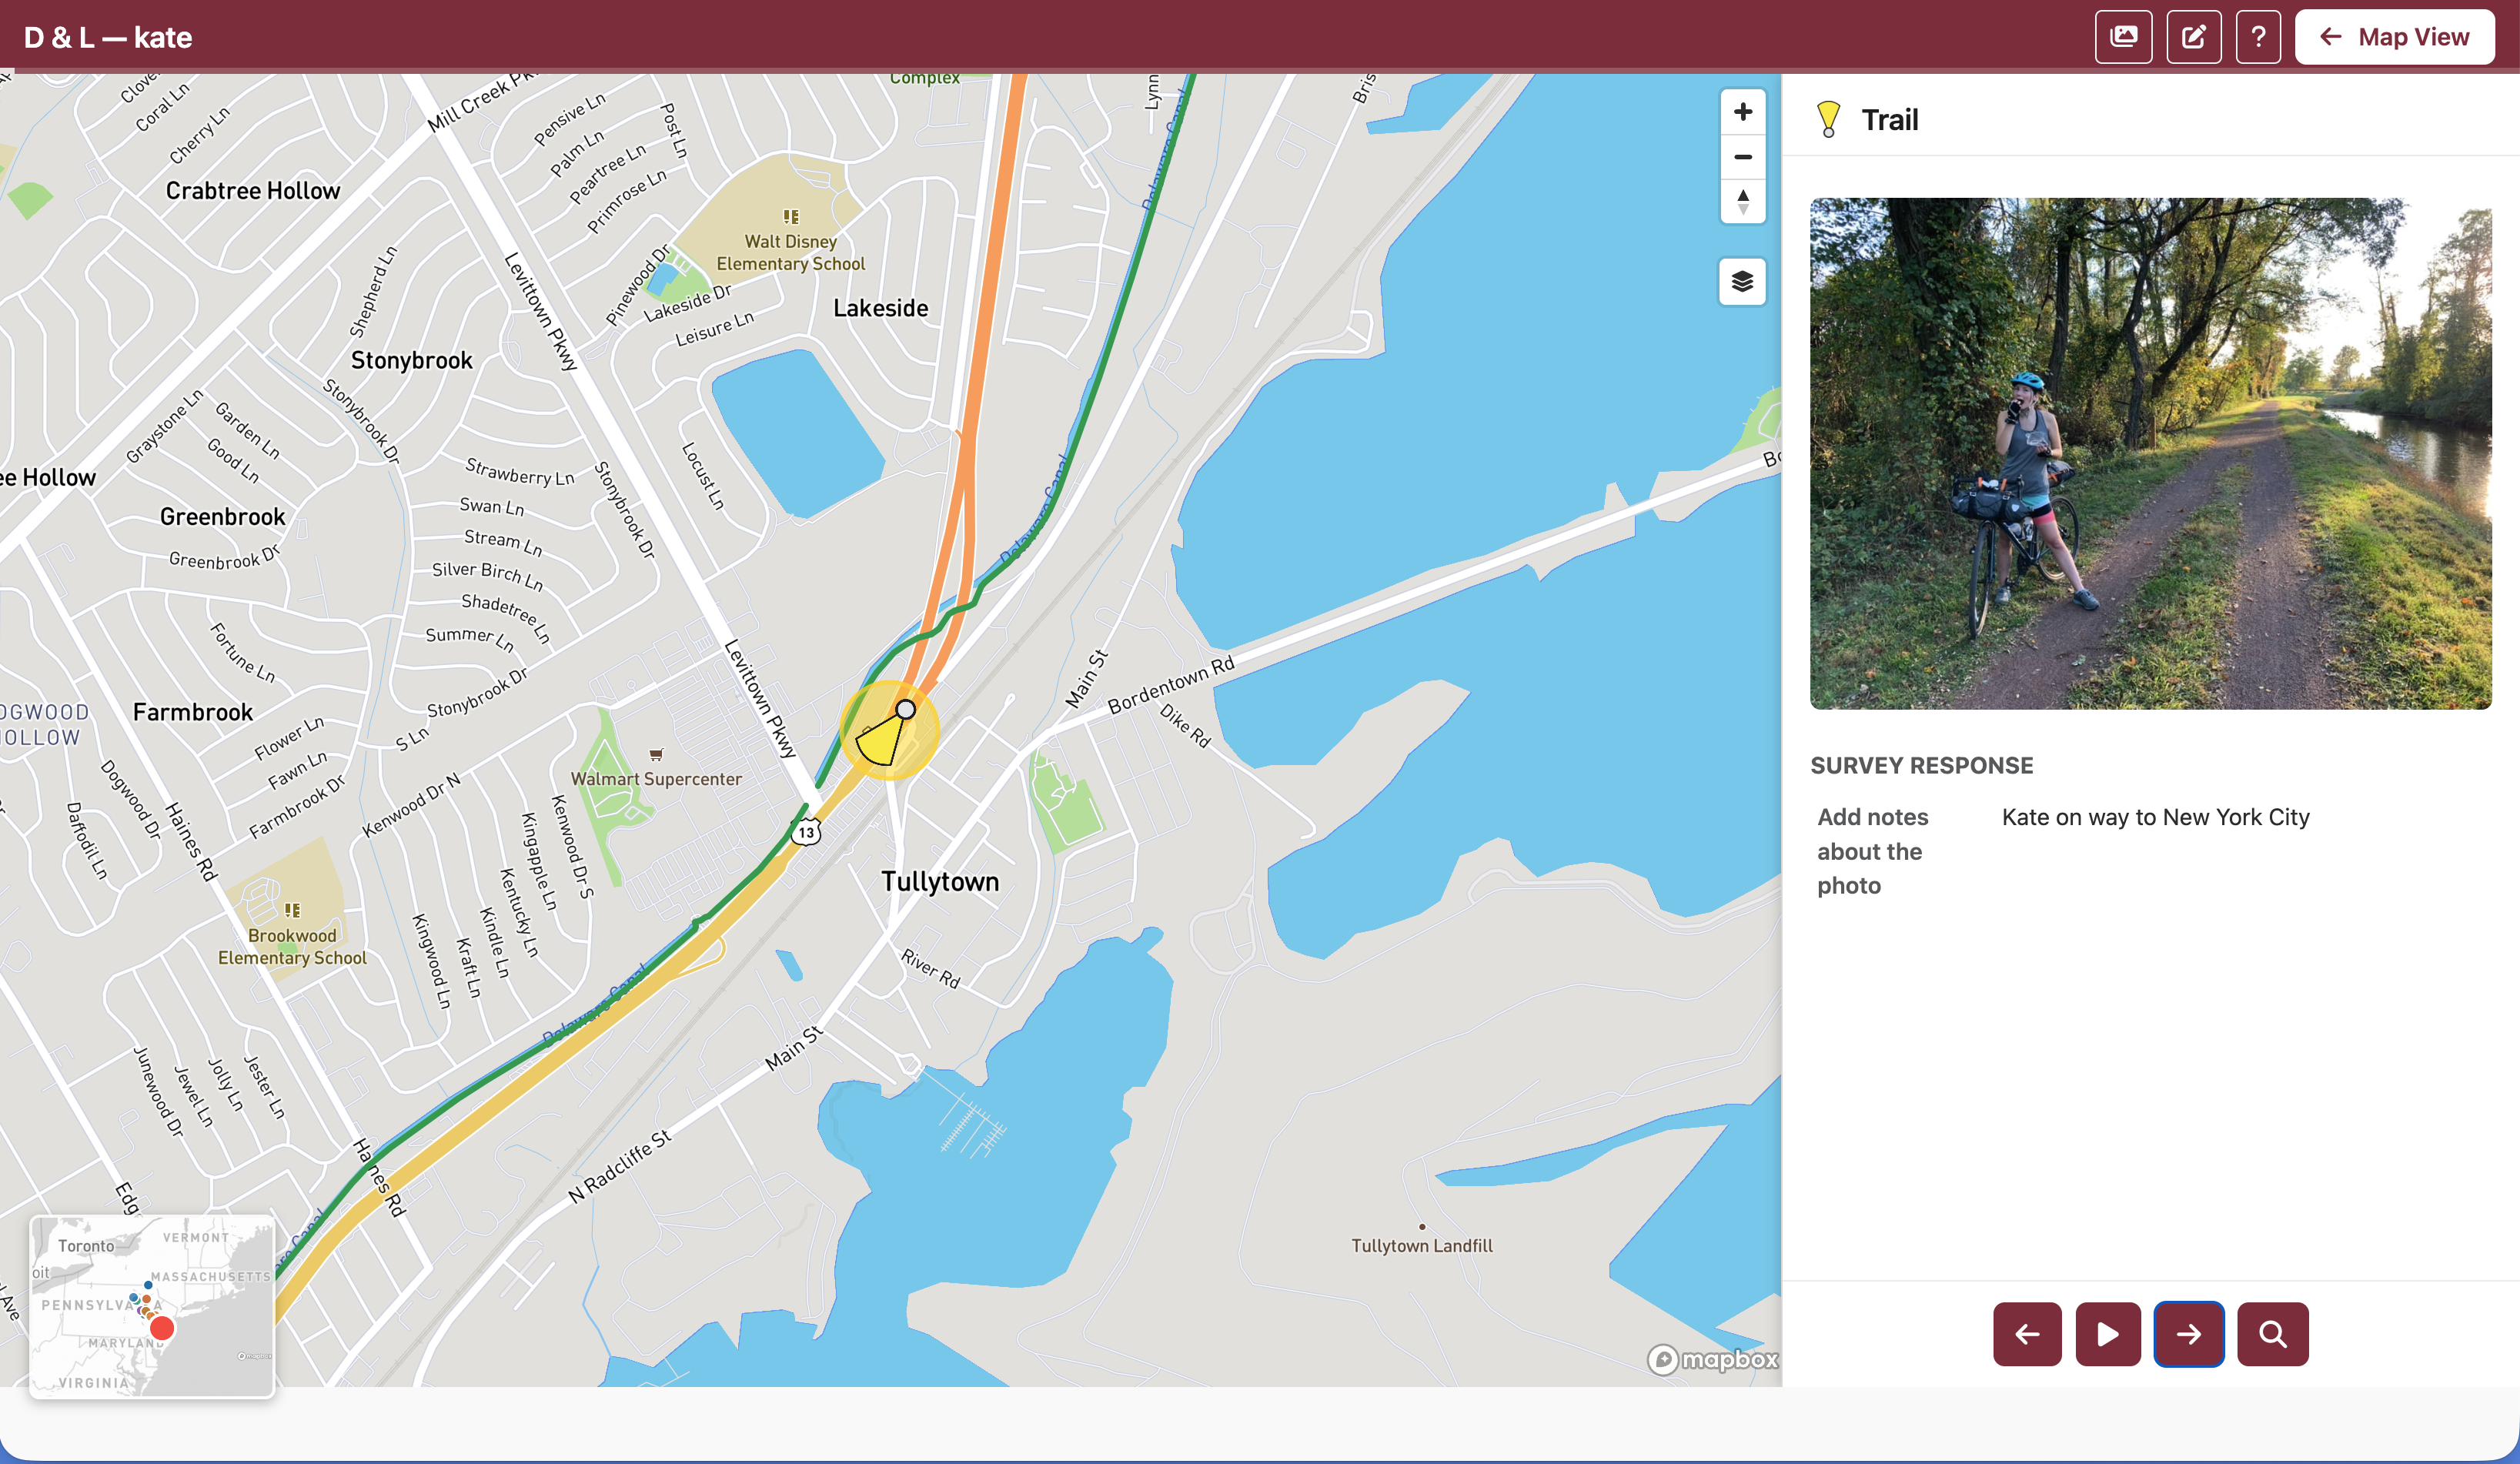
Walk the board through every finding.
Build interactive presentations that fly between map locations. Each slide shows the feature, its photos, and survey data. Share via link or present full-screen at a meeting.
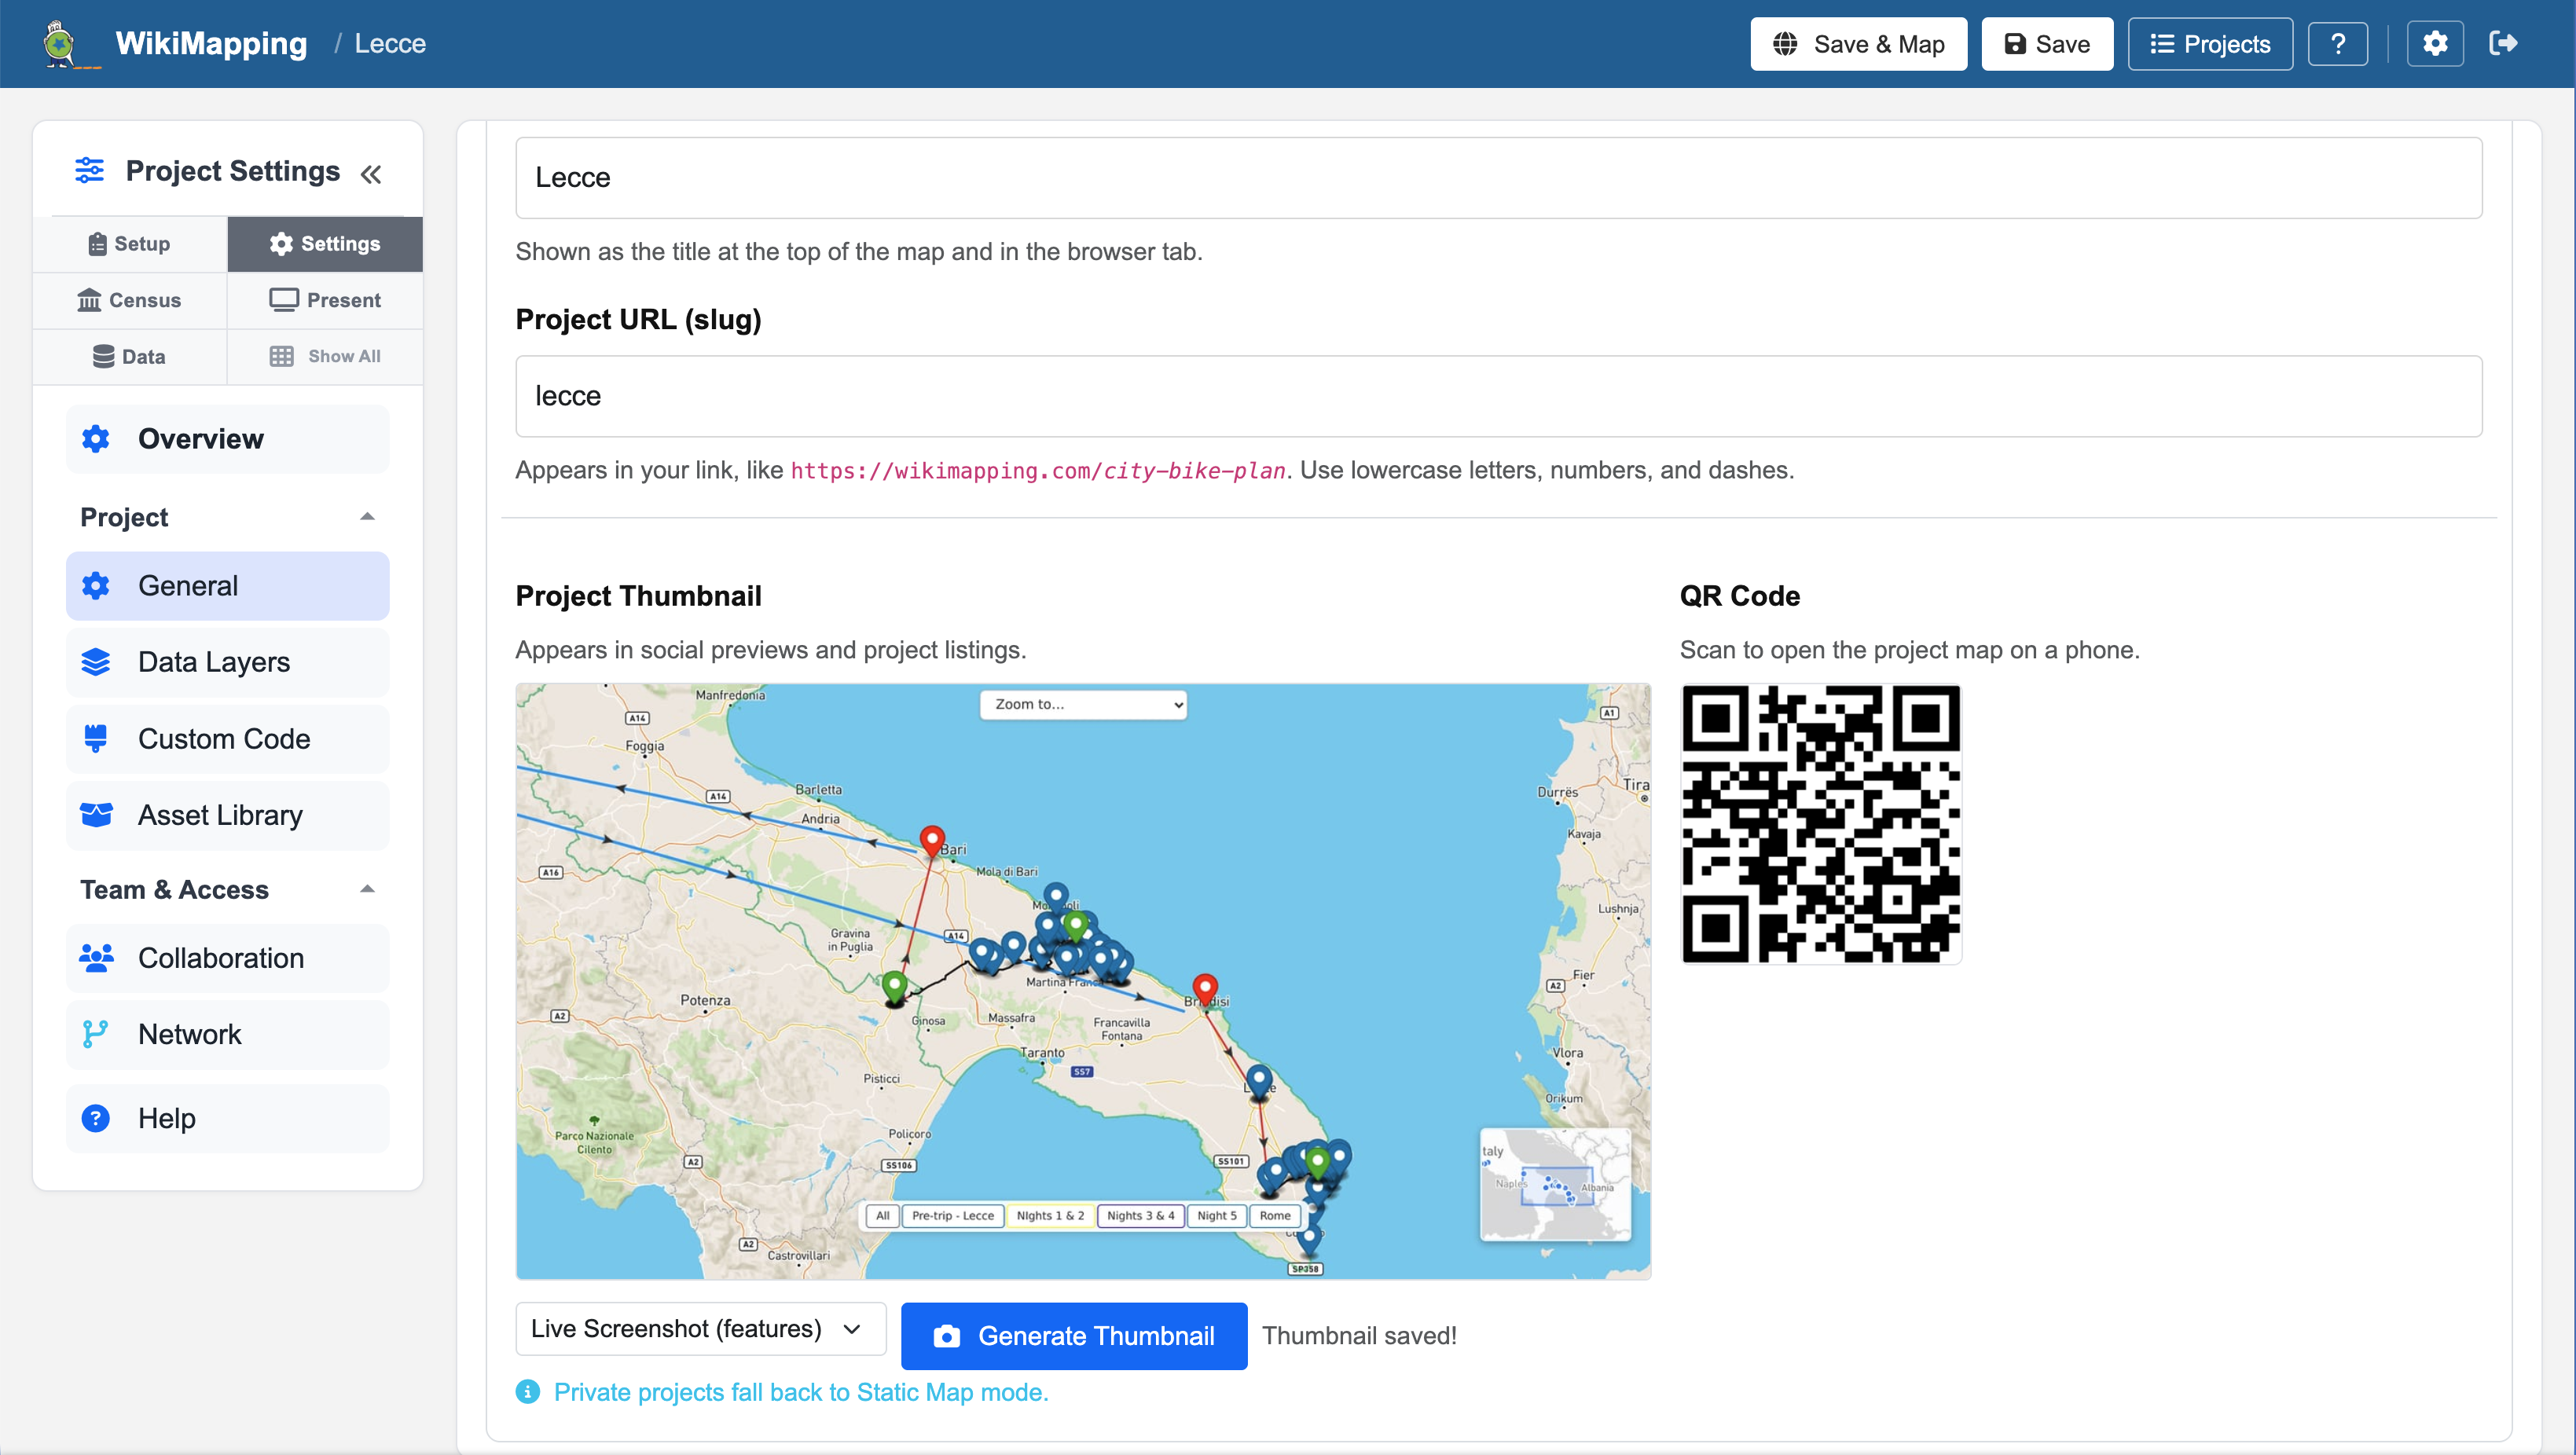
Import data. Analyze demographics. Export to GIS.
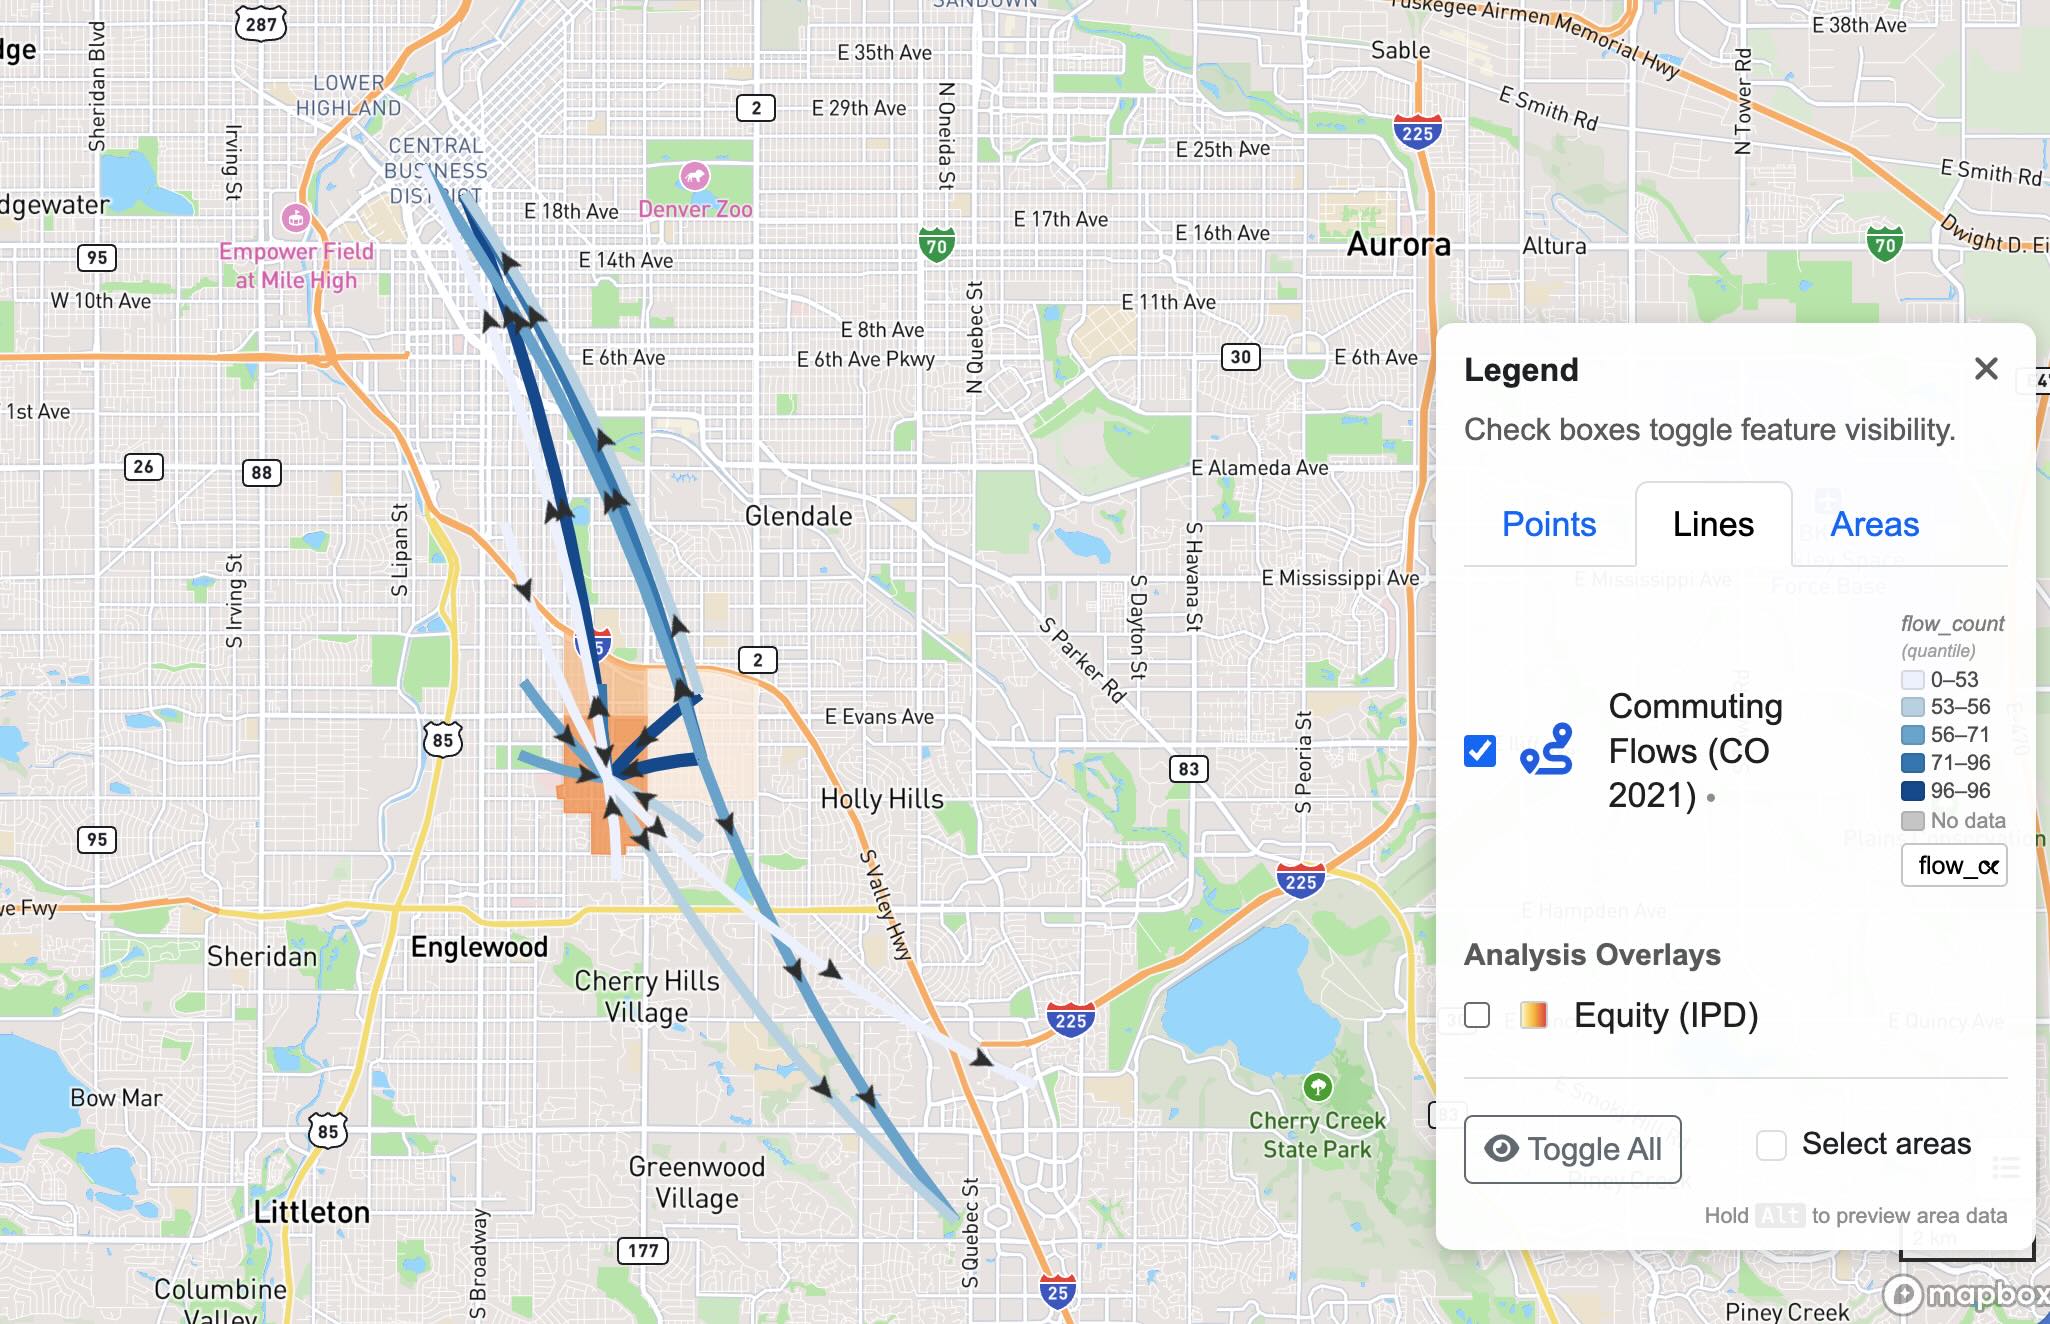
Import GeoJSON, CSV, KML, shapefiles, and geotagged photos. Overlay Census demographics, visualize commuting flows, and compute ratios like population density or renter occupancy — all without leaving the browser.
Export styled data to QGIS, ArcGIS, and GeoPackage with category icons, colors, and survey responses intact. Your GIS team gets production-ready layers, not raw dumps.